
BEGINNER GUIDE / MARKET MECHANICS
Prediction Market Liquidity Explained: Volume, Spread, and Slippage
A prediction market can display a precise probability while still being difficult to trade at that price. The missing context is liquidity: how easily orders can be filled without moving the market. This guide explains volume, bid-ask spread, order-book depth, and slippage in plain language.
Quick answer
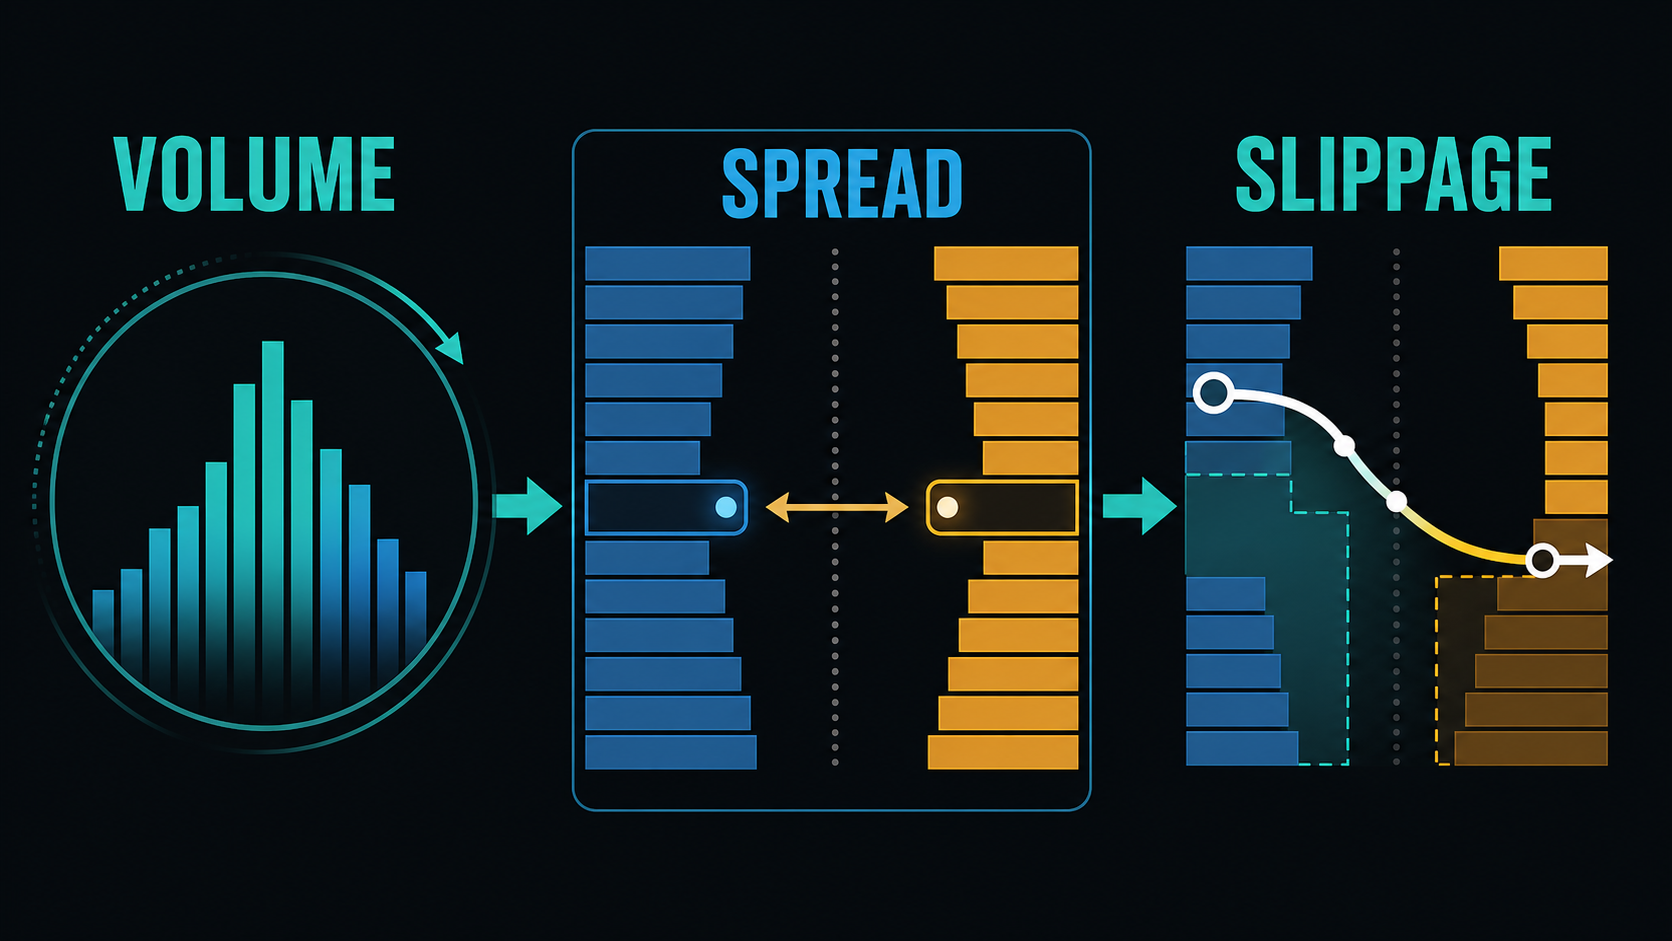
Liquidity tells you how much trading a market can absorb. Volume shows how much has traded, the spread shows the gap between buyers and sellers now, depth shows how many orders are available at nearby prices, and slippage shows how far your average execution price may move when an order consumes that depth. You need all four to judge whether a displayed probability is sturdy or fragile.
What liquidity means in a prediction market
A liquid market has enough active buyers and sellers that ordinary orders can trade near the quoted price. An illiquid market has fewer available orders, so one trade can move the displayed probability sharply.
Liquidity is not the same as popularity, accuracy, or confidence. A popular market can become thin at certain times. A quiet market can sometimes have a tight spread. And a liquid market can still be wrong about the outcome. Liquidity describes the quality of the trading environment, not the truth of the forecast.
The four numbers beginners should check
1. Trading volume
Volume is the total value or number of contracts traded over a period. Higher volume usually means more market participation, but it is historical. A market may have accumulated large lifetime volume and still have a thin order book today.
Use volume to ask whether the price has attracted meaningful participation. Do not use it alone to estimate what your next order will cost.
2. Bid-ask spread
The bid is the highest current price a buyer will pay. The ask is the lowest current price a seller will accept. The difference is the spread.
Suppose the best YES bid is 59 cents and the best YES ask is 63 cents. The four-cent spread is the immediate gap between the two sides. A buyer using a market order may pay near 63 cents, while a seller may receive near 59 cents. The midpoint is 61 cents, but nobody is necessarily offering to trade there.
3. Order-book depth
Depth measures how many contracts are available at each price level. A tight spread can look reassuring, but if only a tiny order is available at the best ask, a larger purchase may immediately reach more expensive levels.
Depth is why two markets with the same displayed probability can behave differently. One may absorb a large order with almost no movement. The other may jump several percentage points.
4. Slippage
Slippage is the difference between the price you expected and the average price you actually receive. It occurs when an order consumes multiple levels of the order book.
If YES is quoted at 63 cents but only a few contracts are offered there, a larger market order might also fill at 65, 67, and 70 cents. Your average cost could be much higher than the first price you saw.
| Metric | What it tells you | What it does not tell you |
|---|---|---|
| Volume | How much trading has occurred | Current execution quality |
| Spread | The immediate gap between buyers and sellers | How much size sits behind the best prices |
| Depth | How many orders are available near the quote | Whether the forecast is correct |
| Slippage | The likely price impact of your order | The final resolution probability |
A simple liquidity example
Imagine a market showing YES near 62%. The order book offers 20 contracts at 63 cents, 40 at 65 cents, and 100 at 68 cents.
- A purchase of 10 contracts can fill at 63 cents.
- A purchase of 50 contracts consumes the first level and part of the second.
- A purchase of 120 contracts reaches the 68-cent level.
The displayed market probability did not suddenly change because of new evidence. The buyer moved through limited liquidity. Anyone looking only at the latest traded price might mistake that mechanical move for a major update in the forecast.
How to check liquidity in 60 seconds
- Read the exact contract first. Liquidity cannot rescue a misunderstanding of the resolution rules.
- Check recent volume. Recent activity is more useful than an impressive lifetime total.
- Compare the best bid and ask. A wide spread signals disagreement or weak competition.
- Look beyond the first order. Inspect several price levels on both sides.
- Preview the order impact. Use the platform’s estimate or calculate the weighted average price.
- Prefer a limit order when precision matters. A limit sets the worst price you are willing to accept, although it may not fill.
Why a precise probability can still be fragile
Trading interfaces often show probabilities to the nearest percentage point or even a decimal place. That formatting can create false confidence. In a thin market, the visible number may represent one recent trade rather than broad agreement among many participants.
This is one reason to read a market price as a signal with conditions attached. Start with how to read prediction market probabilities without overreacting, then use liquidity to judge how much weight the current number deserves.
Liquidity warning signs
- The bid-ask spread is several percentage points wide.
- Only a small number of contracts are available at the best price.
- A modest trade creates a large chart move.
- Recent volume is far below the lifetime total.
- The displayed probability changes without matching external evidence.
- The platform shows a large difference between quoted and estimated execution price.
Ignoring these signs is one of the most common mistakes when reading prediction market probabilities.
Frequently asked questions
Does high volume mean a prediction market is accurate?
No. High volume shows participation, not correctness. Accuracy still depends on information quality, incentives, contract wording, and how well traders interpret the event.
Is a tight spread always a sign of good liquidity?
Not by itself. A tight spread with very little depth can disappear as soon as a moderate order arrives. Check the amount available at several nearby prices.
Why use a limit order?
A limit order protects you from paying above or selling below a chosen price. The trade-off is that the order may fill only partially or not at all.
The practical takeaway
Before treating a prediction market price as a useful probability, check what supports it. Volume gives historical context, spread shows the immediate gap, depth reveals available capacity, and slippage estimates your real execution cost. Together they tell you whether the number on screen is robust enough to take seriously.
Editorial note
This article is educational content. It is not financial, legal, or betting advice. AI may help organize research drafts on this site, but final interpretation and publishing decisions remain editorial.