
Prediction Market Liquidity Explained: Volume, Spread, Depth, and Slippage
Many beginners look at a prediction market, see a price, and assume that number is a clean summary of collective belief. In a liquid market, that can be a reasonable starting point. In a thin market, it can be misleading. A displayed probability may look precise even when only a small amount of trading created it. To understand whether a market is sturdy or fragile, you need to look beyond the headline number and examine liquidity.
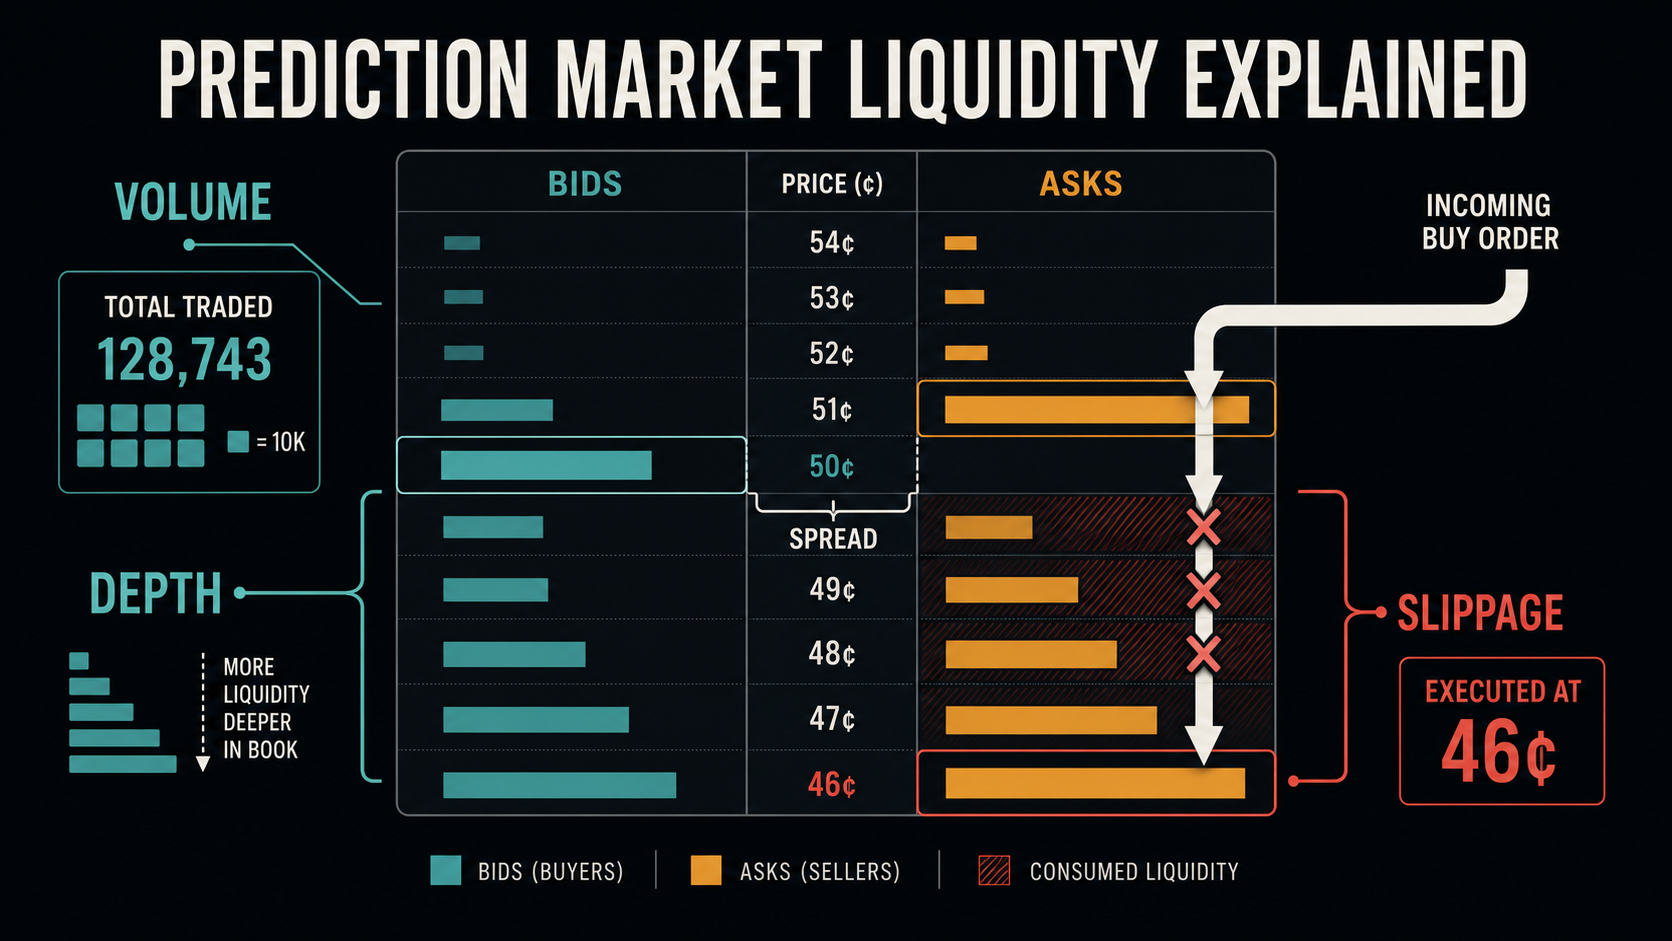
Liquidity describes how easily people can buy or sell without causing a large price move. In practice, beginners can learn a lot from five ideas: trading volume, bid-ask spread, order-book depth, the difference between market and limit orders, and slippage. Once these pieces make sense, the market price becomes easier to interpret and much easier to question when conditions are thin.
Why liquidity matters in prediction markets
A prediction market converts trading activity into a quoted probability. If a contract trades at 60 cents, people often read that as a 60% chance. But that interpretation is stronger when many participants are active, quotes are tight, and meaningful size sits on both sides of the book. When those conditions are missing, the visible probability may reflect very little real agreement.
Think of a thin market as a narrow bridge. It may hold one person crossing slowly, but it does not tell you much about how well it would handle real traffic. A single modest trade can push the price several points, not because the world changed, but because there were not enough resting orders to absorb it. That is why liquidity is not a side detail. It is part of reading the probability itself.
The four core liquidity signals
Volume: how much trading has actually happened
Volume shows how much activity has passed through the market over a period of time. Higher volume usually means more participation and more opportunities for disagreement to get tested through actual trades. It does not guarantee a perfect price, but it often signals that the market has had to absorb more views and more money.
Low volume is a warning sign for beginners. A market with only light recent trading can still display a crisp probability, yet that number may be stale or weakly supported. Ask yourself whether the price has been challenged by active buyers and sellers, or whether it is simply sitting where the last small trade left it.
Bid-ask spread: the cost of immediacy
The bid is the highest current buy offer. The ask is the lowest current sell offer. The difference between them is the bid-ask spread. A narrow spread usually means traders can enter or exit with less friction. A wide spread means the market is less efficient for immediate execution and that the quoted midpoint may hide real uncertainty about where a trade can happen.
For a beginner, spread is one of the fastest liquidity checks. If the spread is wide, it tells you that simply accepting the visible quotes can be expensive. It also suggests that the displayed probability may be less stable than it appears, because there is a larger gap between the best current buyer and seller.
Order-book depth: how much size is waiting
Depth tells you how many shares or contracts are available near the current price. Two markets can show the same best bid and ask, yet behave very differently once you place a meaningful order. If only tiny size is resting at those prices, the first few units may fill nicely and the rest may execute much worse.
Depth matters because it shows whether the current price is supported by real inventory. A market can look calm at the top of the book while hiding a cliff just below it. When depth is shallow, the visible probability is fragile: it can move quickly when one participant trades even a moderate amount.
Market orders, limit orders, and slippage
A market order says, in effect, “fill me now at the best available prices.” A limit order says, “fill me only at this price or better.” Market orders prioritize speed. Limit orders prioritize price control. In liquid markets, the trade-off may be small. In thin markets, it can be large.
Slippage is the difference between the price you expected and the average price you actually receive. Slippage tends to grow when spreads are wide and depth is weak. This is where many beginners get surprised: they see one displayed probability, click buy or sell with a market order, and discover that their fill pushes through several levels of the book.
| Signal | What to look for | Why it matters |
|---|---|---|
| Volume | Consistent recent trading | Shows whether the price has been actively tested |
| Spread | Narrow gap between bid and ask | Reduces execution cost and price uncertainty |
| Depth | Meaningful size near current quotes | Makes the visible probability more durable |
| Order type | Use limit orders in thin books | Helps control slippage |
A practical example of fragile probability
Imagine a market showing 52%. At first glance, that looks close to even. But now look at the book. Perhaps the best bid is 50 for a small size, the best ask is 54 for a small size, and only a little additional size sits nearby. If one trader sends a market buy that is larger than the small amount available at 54, the order may consume that level and start filling at higher prices. After the trade, the displayed probability might jump to 57% or 58%.
Did the underlying event suddenly become much more likely? Not necessarily. The move may say more about weak liquidity than about stronger information. In this situation, the headline probability was fragile because it rested on a thin layer of orders. A beginner who looks only at the new displayed number might think the market learned something important, when in fact the bigger lesson is that the book was shallow.
The 60-second liquidity check
Before treating a market price as meaningful, spend one minute checking whether the market can actually support that interpretation. This habit is simple, fast, and often more useful than staring at the probability alone.
- Check recent volume and ask whether trading has been active enough to test the price.
- Look at the bid-ask spread and note whether it is tight or obviously wide.
- Inspect depth near the best prices instead of looking only at the top quote.
- Estimate what would happen if you traded your intended size right now.
- Prefer a limit order if the book looks thin or the spread looks expensive.
- Pause if a small order seems able to move the market several points.
This checklist will not make every market easy to read, but it can stop a common beginner mistake: treating a printed probability as stronger than the market structure behind it.
Short FAQ
Is high volume enough on its own?
No. Volume helps, but you should still check spread and depth. A market may have traded actively earlier yet still be thin right now.
Why can the displayed probability be misleading?
Because the displayed price may come from only a small amount of tradable size. If the book is shallow, the number can move sharply without much money changing hands.
When are limit orders especially useful?
They are especially useful when spreads are wide, depth is poor, or you are trading a size that might sweep through multiple price levels.
Final practical takeaway
For beginners, the best rule is simple: do not read a prediction market probability without reading its liquidity. Volume tells you whether the market has been active, spread tells you the cost of immediacy, depth tells you how much support sits behind the quote, and slippage tells you what can happen when you trade into a thin book. A market can display a neat percentage while still being structurally fragile. The more often you pair price with liquidity, the less likely you are to confuse a weak quote with a strong signal.
What to read next
This article is for educational purposes only and explains market mechanics rather than offering trading, betting, or financial advice.